Top
Graphic User Interface
HKSAT Menus HKSAT Views
File Menu
New Project (Ctrl+N) creates a new project. For more information, see Creating Project .New Mobilgene/ODIN Project Creating a new project in the Mobilgene/ODIN project.Open Project (Ctrl+O) opens the project file.Open Recent opens from recent projects.Save Project (Ctrl+S) saves the project.Close Project closes the project.Preferences opens Preferences. For more information, see Setting up
HKSAT .Manage Compilers opens Compiler Management Window. see Managing Compilers .Open Target Folder opens the target folder in File ExplorerOpen Log Folder opens log folder in File ExplorerRestart restarts HKSAT.Exit exits HKSAT.
Project Menu
Project Configuration changes the project settings. The compiler cannot be changed.Import Project Information (Mobilgene/ODIN) gets Mobilgene/ODIN project information. For more information, see Importing Mobilgene/ODIN Project Information .Export Project Analysis (CI/CD) Exports analyzed information for CI/CD integration.Open Project Folder opens the project folder in File Explorer.
Module Menu
Add Module adds a module. For more information, see Creating
Module .Edit Module edits a selected module.Rebuild Module regenerates a selected module.Manage Module (Ctrl+M) shows the Module View .
Analysis Menu
Add Analysis adds an analysis. For more information, see Creating Analysis .Add Multiple Analysis opens the analysis type selection dialogEdit Analysis edits a selected analysisExecute Analysis executes a selected analysis.Execute Multiple Analysis opens the analysis execution dialogSelect Current Analysis selects the current analysis.Manage Analysis (Ctrl+A) shows the Analysis View .
Report Menu
Generate SW Test Report creates a SW Test Report. For more details,
please refer to How to Create a SW Test Report .Generate Project Report creates a project report. For more details,
please refer to How to Create a Project Report .Generate Cyclomatic Complexity Report creates a report containing cyclomatic complexity of each function Manage Report opens the report management window.
Window Menu
Show view shows and activates that view.Show All makes all views visible.Hide All makes sure that all views are not visible.Maximize View (Alt+F11) maximizes a selected view.Maximize app (F11) mazimizes the main window.Themes choose one of the GUI style themes.Window Setting opens the Window Setting dialog.
When you press F1, a description of the active view is displayed in the Help.
Layout Menu
Default applies the default layout.Code Review applies layouts for code reviews.Module Review applies layouts for module reviews.Analytics Review applies layouts for analytic reviews.Load Layout selects and applies a window layout file.Save Layout saves the window layout as a file.Undo Layout (Ctrl+Z) reverts to the previous window layout.Redo Layout (Ctrl+Y) re-applies the reverted window layout.Reset Layout reverts window placement to its initial state.
Help Menu
Help (F1) displays the appropriate help depending on the current status.User Manual displays the user's manual in the default browser.How to Video (Web) displays the HKSAT Usage Video web page in the default browser.HKSAT Homepage opens the HKSAT Homepage in the default browser.HKSAT Support opens the HKSAT Support page in the default browser.Check Update checks whether an update is available. If the latest version is installed, shows the
Report Error enables error reporting. For more information, see Reporting Errors .License Info displays license information.About HKSAT displays program information.
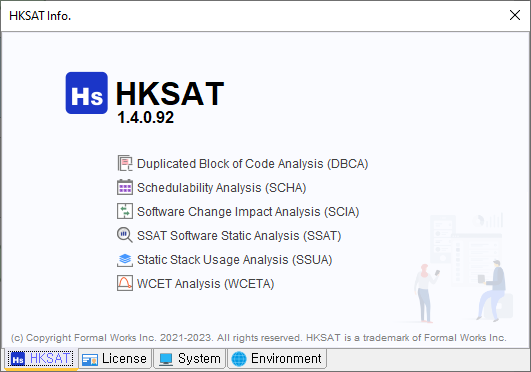
About HKSAT
Modules, analysis, function call, and search views can be enabled or disabled in RootFrame settings,
and disabled views are not shown in the menu and the toolbar.
Most features provided by HKSAT for an item are accessible through the corresponding context menu.
Items of a context menu are determined according to the type of the target node
Mouse Pointing shows the information in other viewsLeft Click selects an itemLeft Double-Click opens the item in other viewsRight Click opens the context menuCtrl + Left Click adds the item to the selectionShift + Left Click selects items as a rangeAlt + Left Double-Click edits the item
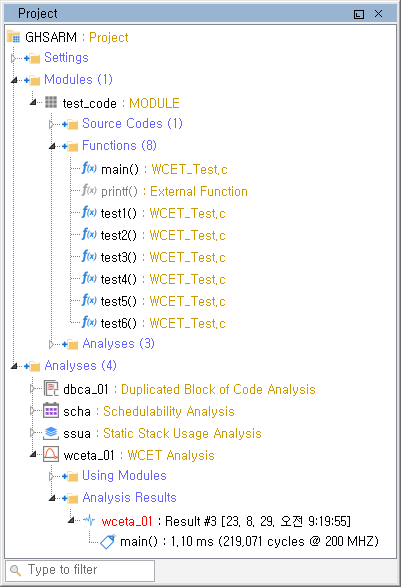
Shows the structure of the current project as a tree. You can use filters to
view only the desired items, and you can also expand or collapse the entire
tree.
Project View
Global settings
Shows the information of a project such as author, created date, modified date, and target language.
Modules
Shows the information of each module in a project.
Source Codes shows a list of source codes registered to a module.Functions shows a list of functions of a module. shows a list of analysis using a module.
Analysis
Shows the information of each analysis in the project.
Usage Modules shows the target modules of an analysis.Analysis results summarizes the result of an analysis.
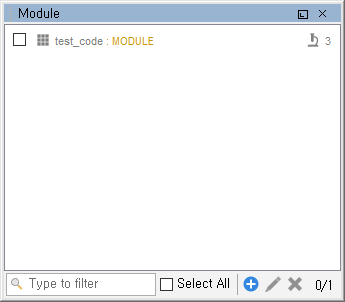
Browses and manages the modules of a project.
Module View
Some features are enabled only if one or multiple modules are selected.
Only when analysis using the module exist, an analysis icon is shown with
the count.
You can use filters to view only the desired modules, and you can also
start adding, editing, or deleting modules.
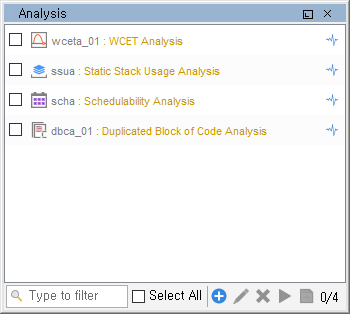
Shows the analysis included in the current project.
Analysis View
The current analysis is highlighted in red color.
Only when the analysis has a result, a result icon will be shown.
You can use filters to see the desired modules only, and you can also
start adding, editing, or deleting modules.
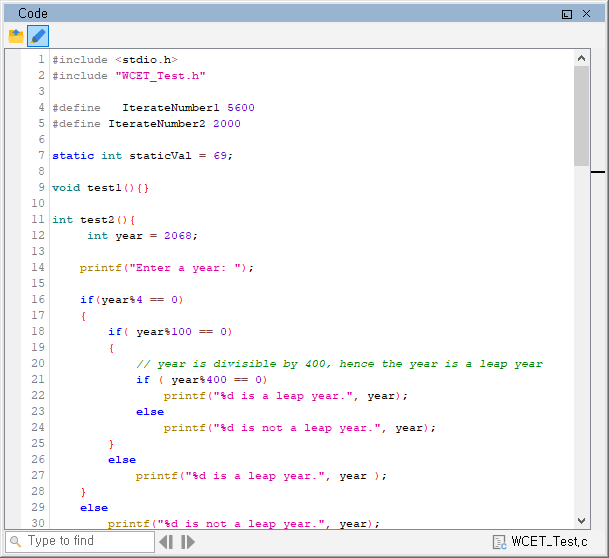
Displays a source code with syntax highlights.
Code View
When a source code, a function, or a location is selected, the relevant source code is
displayed.
Highlights the result of the current analysis. For example, double-clicking duplicates in a DBCA result displays duplicate code blocks.
The highlight colors of each analysis can be changed through the analysis configuration page.
The analysis icon is shown in the left margin of each highlights.
The locations of errors are shown in the right margin. You can move to the error location by clicking one.
The source code view is read-only and cannot be edited.
If a source file is modified externally, the corresponding module must be rebuilt to reflect the change.
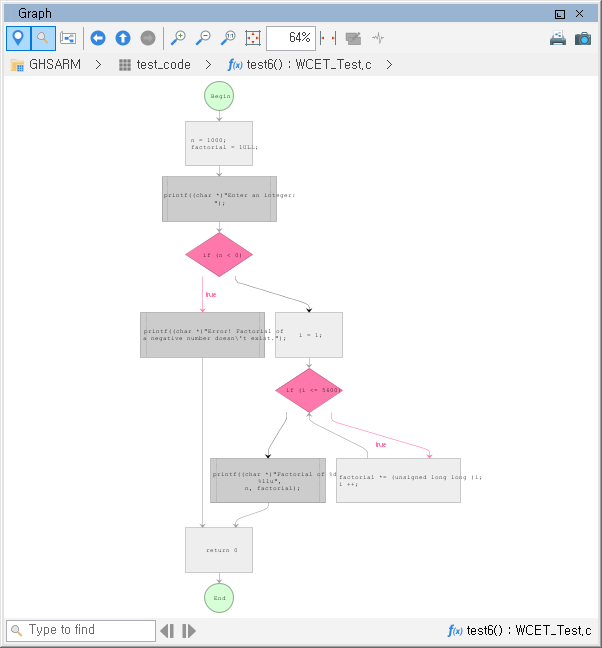
Displays Project Graph , Call
Graph , or Control Flow Graph
Graph view
Toolbar
Graph view Toolbar
Toggle Location Bar shows/closes the location barToggle Search Bar shows/closes the search barShow Overview displays an overview of the graph when enabled.Open Previous opens the previous graph.Open Parent opens the parent graph.Open Next opens the next graph.Fixed Node Size shows nodes in a fixed width. For CFG only.Show Current Analysis Results toggles the current analysis results in the
graph. Enabled only when a result can be shown in the graph.Zoom In zooms in on the graph.Zoom Out zooms out of the graph.Zoom Normal displays the graph in original size.Fit to Content displays the graph according to the content.Zoom Ratio displays the zoom ratio.Print Graph prints the graph.Save as picture saves the graph as a picture.
If the number of nodes is too large, the graph may not be displayed.
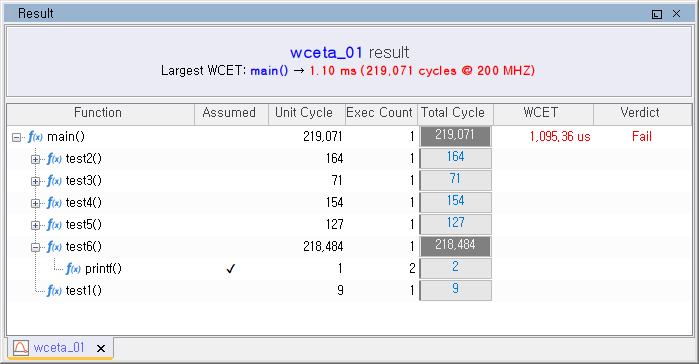
Displays the results of the analysis.
Results view
Since each result is displayed in a single tab, you can include multiple results.
The results will be displayed differently depending on a type of analysis. For a description of the
results of the analysis, see the results screentip for each analysis.
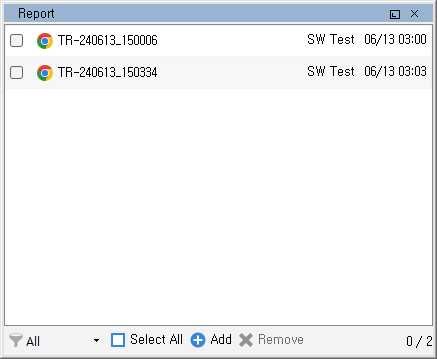
Use to manage reports.
Report view
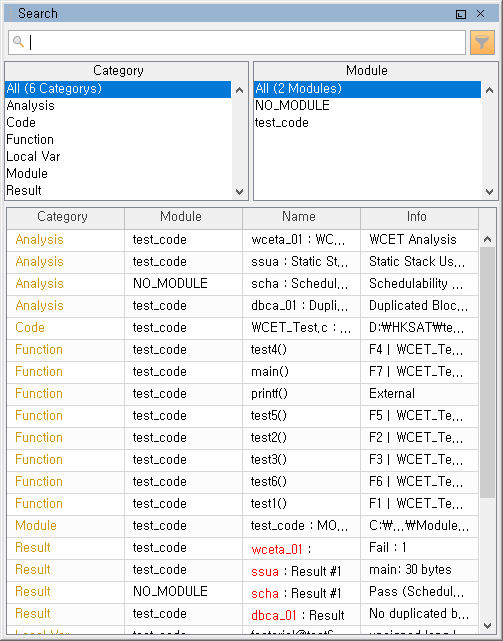
Use to search for items, such as type or name.
Search view
Search box : Enter keyword to search for, such as your name.Show/Hide Filter Pane : Displays or hides the filter panel. The
icon color changes when a filter is set.Category : Limits categories to search.Modules : Limits modules to search.Result : Displays the filtered items.
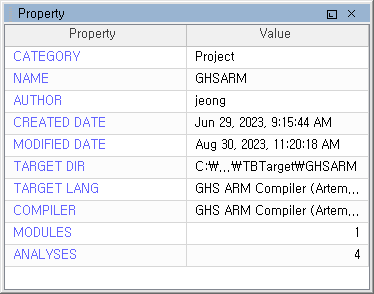
Displays the attributes of the selected item.
Properties View
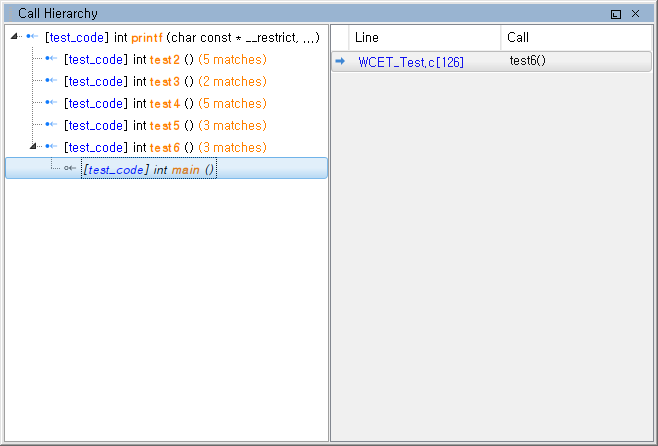
You can find functions that call them based on a specific function and their location.
Call Hierarchy View
How to Use
When you drag and drop a function from Project View, the caller functions are displayed as
child nodes.
When you select a caller function, the call locations are displayed in the right panel.
Double-clicking the call location displays the associated source code in Code View.
If callers exists, the node can be expanded the node by double-clicking it; ohterwise, it is displayed as a
terminal node.
You can add a function to the function call view by selecting the Call Structure Open sub-item in the
Function-call-by entry of the function context menu.
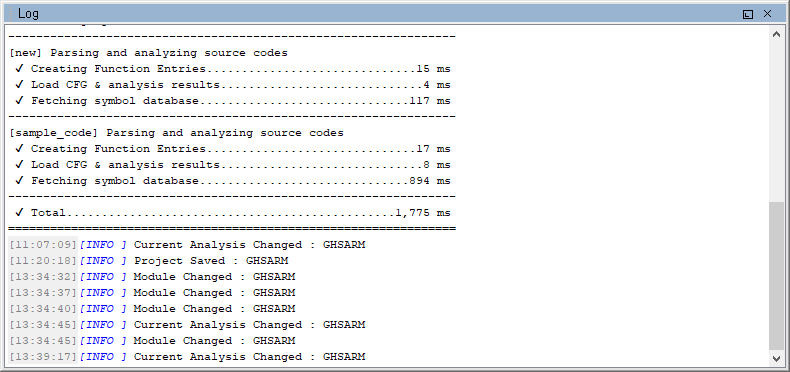
Displays log.
Log View
You can choose whether to enable system log, time information, and location information in
LogViewer setting.