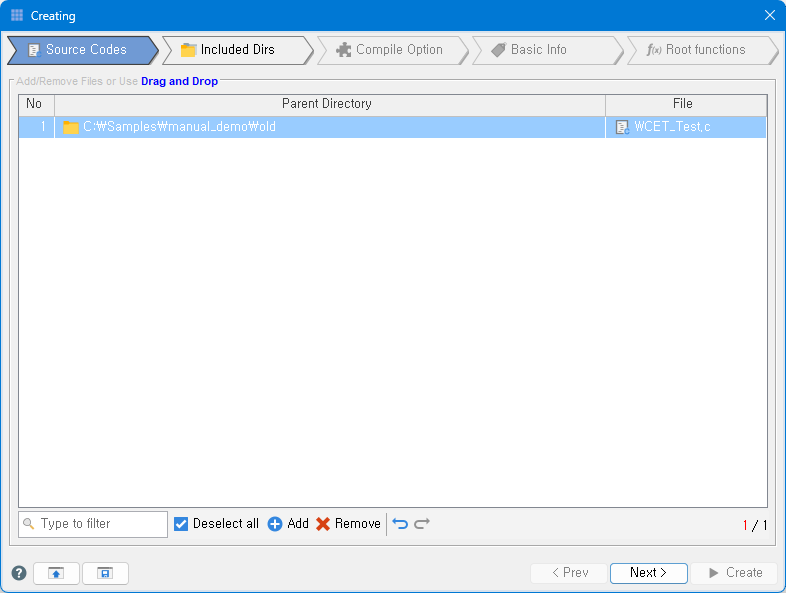
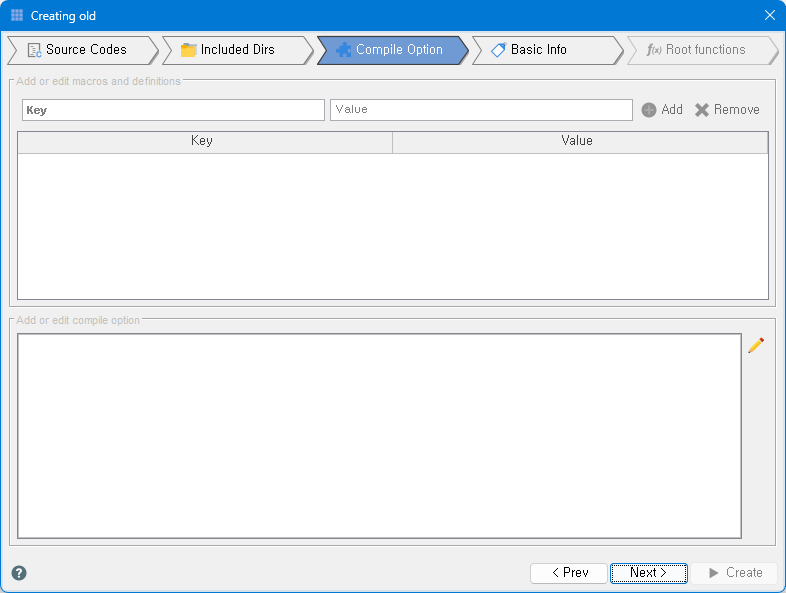
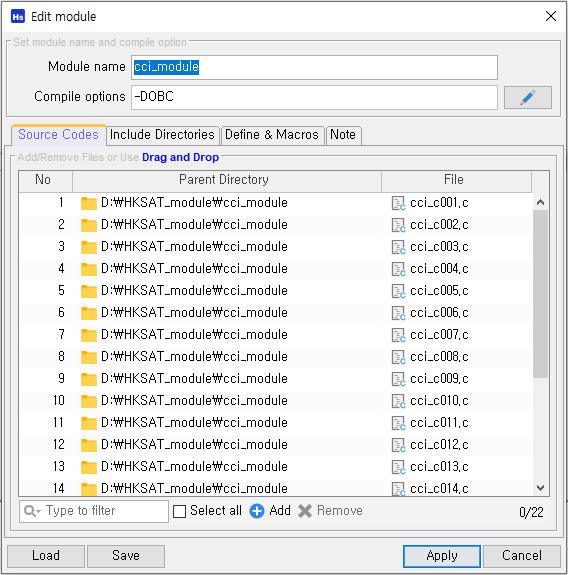
For a successful compilation, all macro and options used by source codes should be provided.
This feature can be replaced by "-D [name]" or "-D[name]=[definition]" compile option.
Note that, some GHS compiler opitons such as -c(compile only), -G(Debugging info) are prohibited, the list can be changed in Comple Setting.
Validation and Pre-analysis
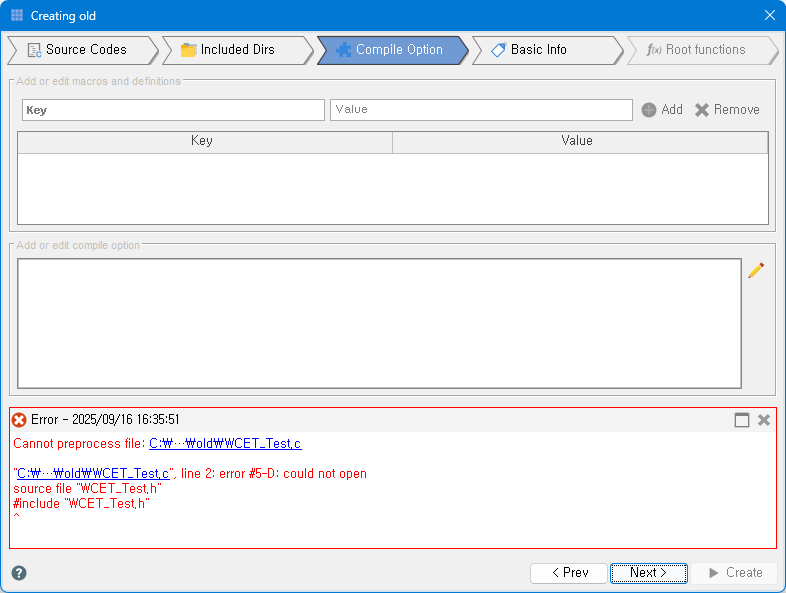
After entering compile options, the validation and pre-analysis are conducted based on entered information
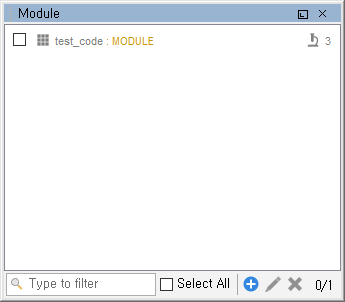
Modules are created after the validation and the Pre-analysis of the input.>
Pre-analysis extracts information from the source codes.
Pre-analysis checks that the input is valid.
Rebuilding a module from modified input after a failure could use cache for the performance, unless
the compile option is modified.
If the input module information is invalid, the pre-analysis will fail, and no modules will be added.
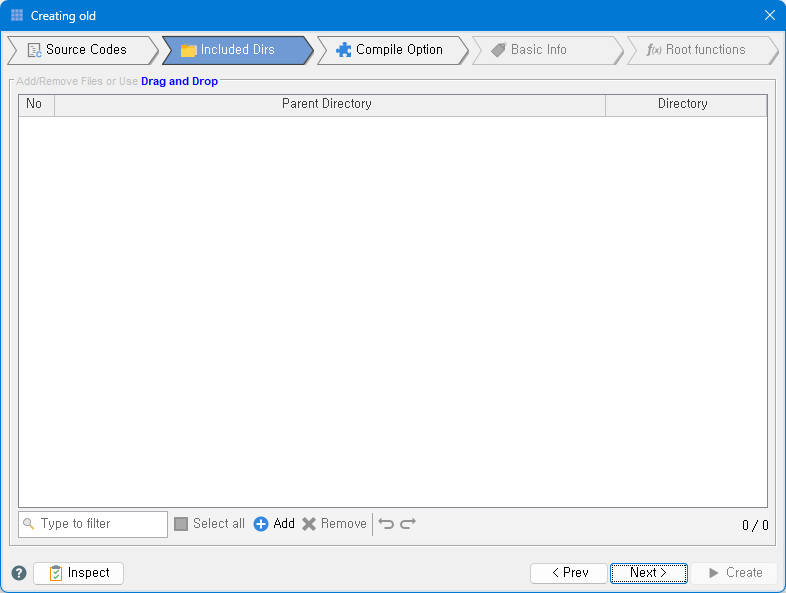
If you include too many directories, you may encounter errors, and to avoid this, we recommend that you
select a major parent directory to reduce the number.
If the information for compiling is incorrect, module creation may fail. If the module creation fails,
make sure the input is correct.
If the module creation continues to fail even if the information for compilation is correct, you can use
the error reporting feature to report errors.
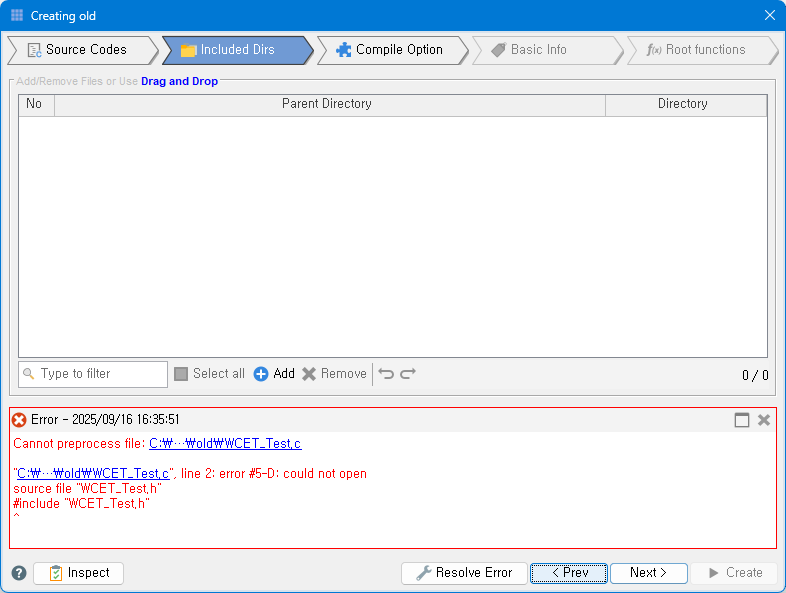
Resolving Include Errors
When the validation and pre-analysis fails, error message appears
Directory inclusion errors can be resolved using the feature that finds missing directories.
Check the type of errors, and move to the Included Dirs tab.
Directory inclusion errors
In the Included Dirs tab, click Resolve Error button.
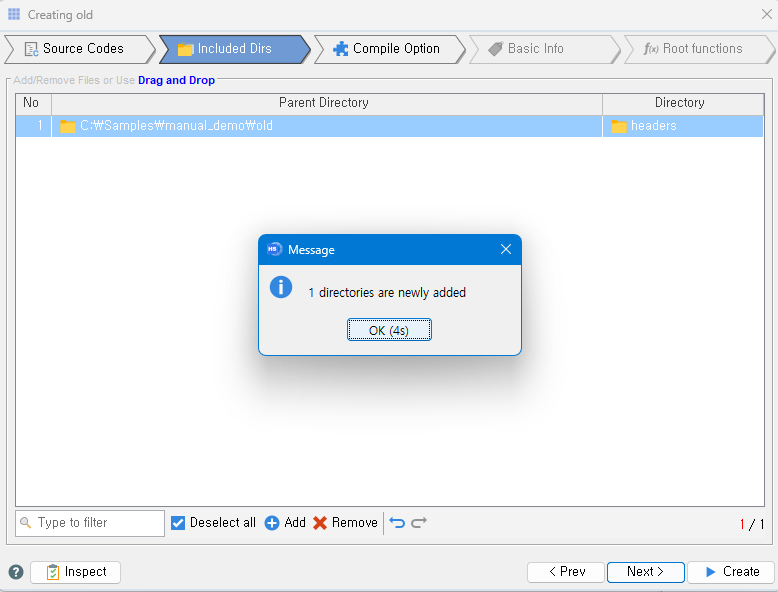
Resolving Error
HKSAT searches missing directories and adds them.
Check added directories and click Next button.
Checking added Directories
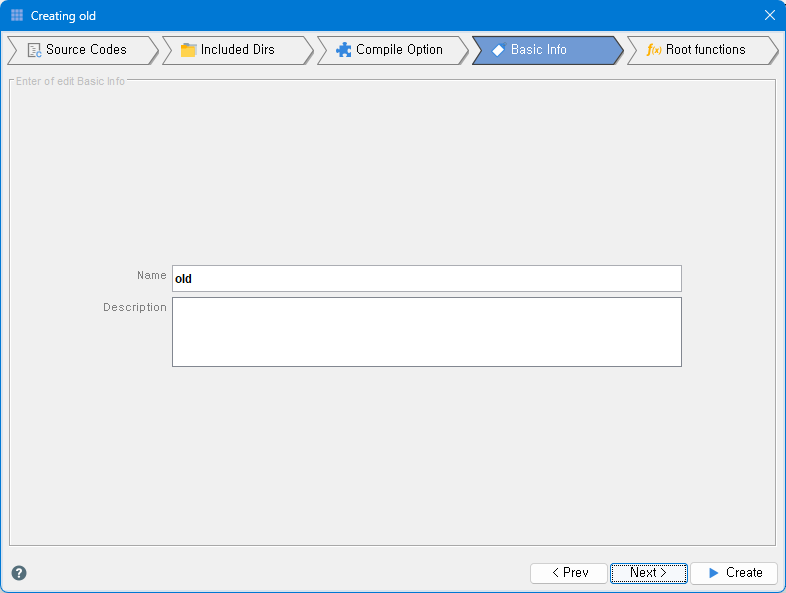
Module name must be within 32 characters, and only a combination of English alphabet and numbers is
available. Spaces, Unicode, and special characters are not available.
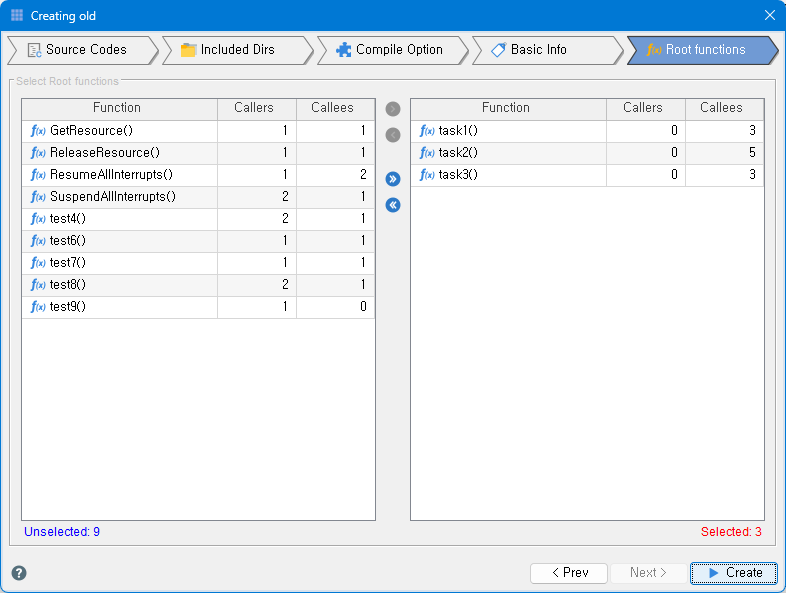
Selecting Root Functions
Add Module - Root Functions
Select root functions to be used for creating analyses.
Click Create button to finish a module creation process.
The modules added to the project have source code information extracted from a dictionary analysis of the module
creation process, which includes program basic information such as function lists, variable lists, function call
relationships, and variable usage relationships. This information is easy to see using the various views
provided by HKSAT.
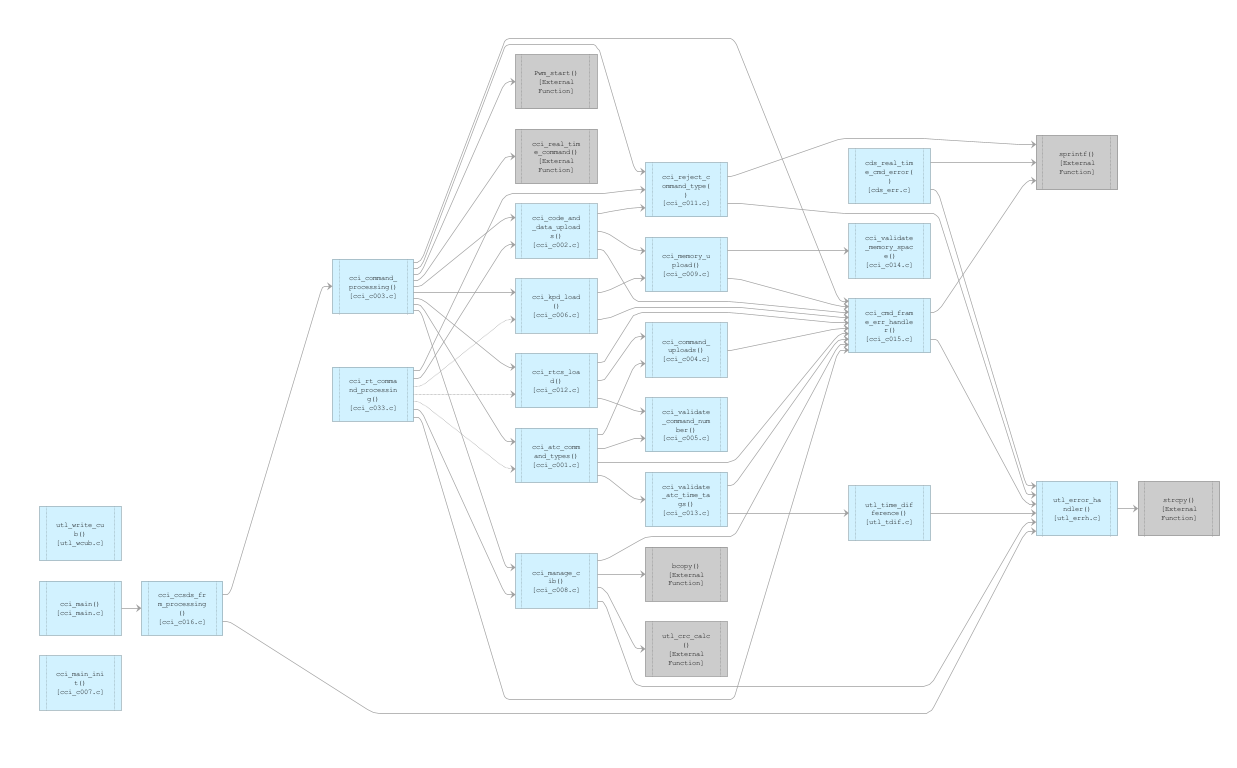
The call relationship of functions in a module can be displayed as a function call graph. The function call graph
visually shows the call relationship between functions contained in the module. The nodes in the graph display
each function, and the edges show the call relationships between them. This makes it easy to understand the
associated function information and the overall flow of calls.
To display a graph of function calls in a module:
Double-click the Module node in the project view.
Call Graph
An alternative way
Double-click the Module node in the project graph.
Open the Graph Viewer and drag the module nodes of the project view to the Graph Viewer.
Functions and functions are linked to the calling edge.
Functions that do not exist in the source code are defined as external functions and are displayed
differently.
When a node is selected, the function that calls that function and the function that is called by that
function are highlighted.
When you click a node, the properties view displays details about the function.
Double-clicking a node displays the control flow graph of that function in the Graph Viewer, and the
source code for that function is displayed in the SourceCode view.
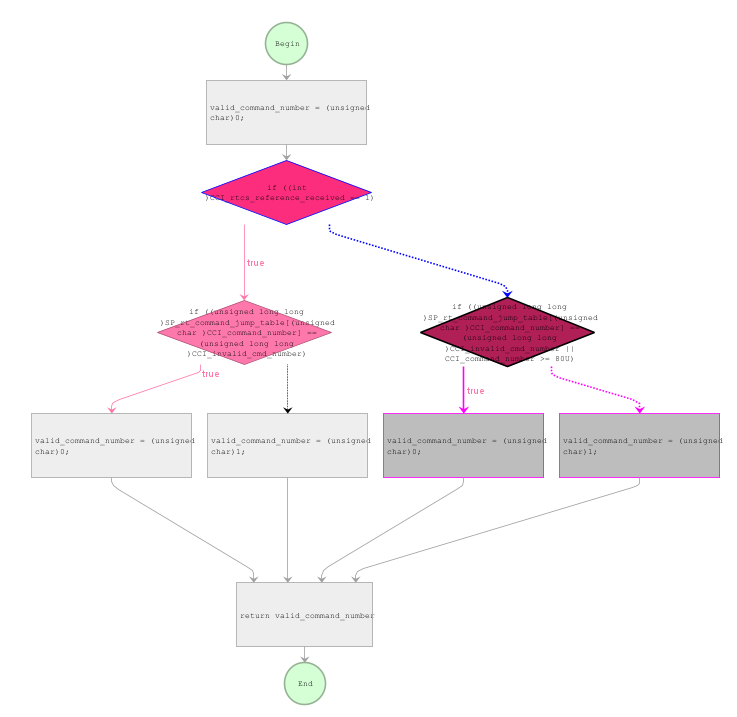
The control flow of a particular function can be displayed as a control flow graph. The Control Flow graph
consists of a program flow chart, which visually displays control flow and details to visually show the order in
which each component runs. The nodes in the graph display the components of each function, and the edges display
the control flow (execution order) between them.
To display a control flow graph of a function:
Double-click the Functions node in the project view.
Control Flow Graph
An alternative way
Double-click the function node in the function call graph.
Open the Graph Viewer and drag the Function node of the project view to the Graph Viewer.
When a node is selected, the syntax that runs before that syntax and the syntax that runs after that
syntax are highlighted.
When you click a node, the Properties view displays details about its syntax.
Double-clicking a node displays the source code for that syntax in the source code view.
View function details
View function details extracted from the pre-analysis. Here's what you can see:
Declaration Location: Displays where the function was declared. The location is displayed by the source code
file name and line number.
Definition Location: Displays where the function is defined.
Call location: Displays where the function is called.
Call function: Displays a list of functions that the function calls.
Assignment Location: Displays where the function is assigned.
Where used: Displays where the function is used.
Variable Declaration: Displays a list of variables declared by the function.
Variable Allocation: Displays a list of variables that the function assigns.
Use Variables: Displays a list of variables used by the function.
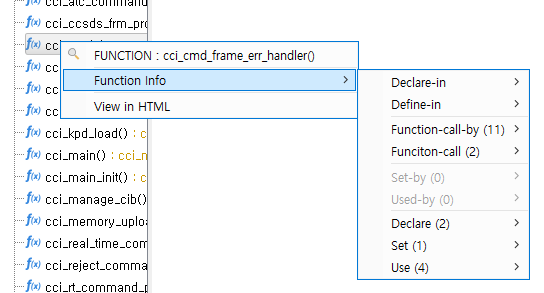
To view function details
Float the context menu with a right mouse click on the function node in the project view or the function
node in the function call graph.
Function Context menu
Select the menu item you want.
If the information does not exist, the menu is disabled.
Some menus display the number of descendants in parentheses.
Understand the structure of function calls
You can use the Function Call view to recursively track function call relationships. The function call view can
recursively track the function call structure, providing an intuitive understanding of the impact of related
calls.
Displays functions that call specific functions and where they are called as sub-nodes, and recursively displays
them until there are no more nodes calling them. This makes it easy to understand which functions are calling a
particular function and which functions are calling it.
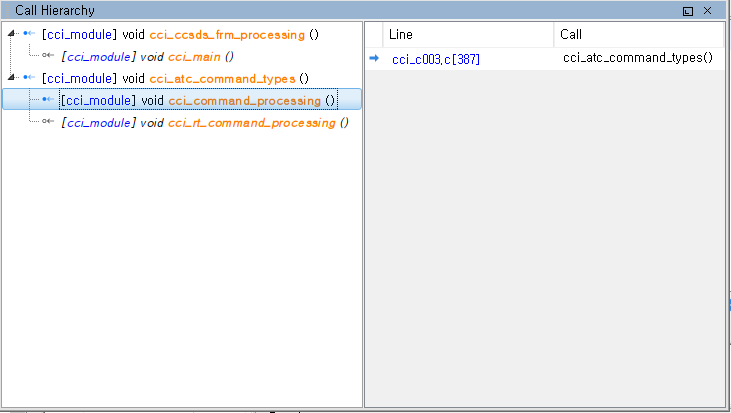
To display the call relationship of a particular function in the function call view
Open the function call view.
Select a specific function in the project view, and then drag it and drop it in the Function Call window.
Function Call View
An alternative way>
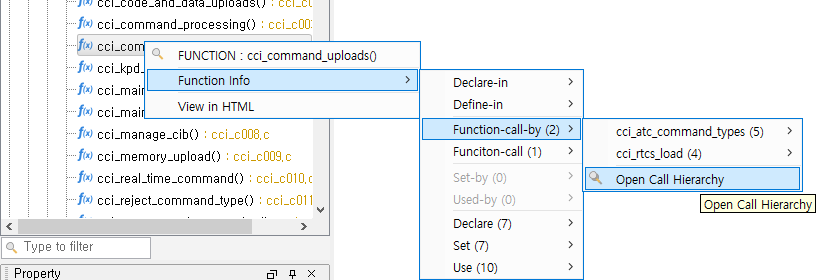
In the Project View, right-click on the function node to pop up the context menu, select the call location,
and select the Open Call Structure entry from the submen menu.
Open Call Structure menu
In the Functions node of the Function Call Graph, right-click to pop up the context menu, select the calling
location, and select the Open Call Structure entry from the submen menu.
In the Function Call view, the node icon is displayed in blue if there are other functions that call a
particular function, otherwise it is grayed out.
If it is called multiple times, clicking the calling function displays a list of call locations on the
right screen.
View variable details
View variable details extracted from the pre-analysis. Here's what you can see:
Declaration Location: Displays where the variable was declared. The location is displayed by the source code
file name and line number.
Definition Location: Displays where the variable is defined.
Assignment: Displays where values are assigned to variables.
Enabled: Displays where variables are used.
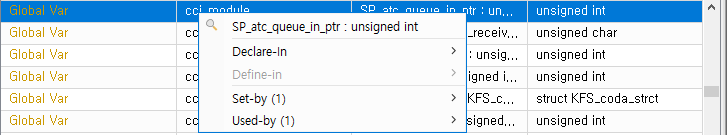
To view variable details
Floats the context menu with a right-click on a variable item in the selection view.
Variable Context Menu
Select the item you want.
If the information does not exist, the menu is disabled.
Some menus display the number of descendants in parentheses.